In MeritorQ value is measured by comparing the free cash flow generation ability of a company versus its share price, a valuation measure known as P/FCF. We show that in India P/FCF is superior to other commonly used relative valuation measures like P/E, EV/EBITDA, and P/B. In fact, a free cash flow-based measure of relative value offers multiple benefits relative to the cruder relative valuation multiples that most investors use. These benefits include the ability to more consistently identify companies with sound fundamentals trading at attractive valuations.
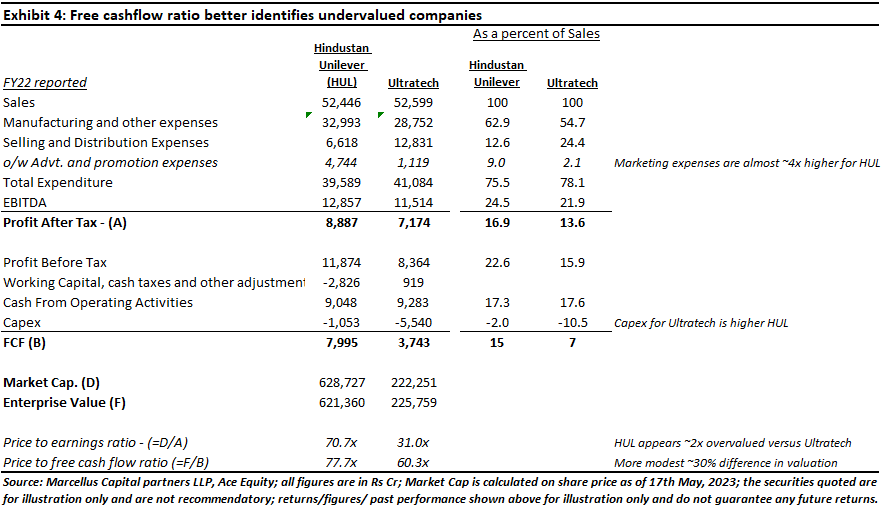
Why doesn’t the team at Marcellus focus first and foremost, as many other investors do, on earnings or earnings per share or earnings growth? The simple answer is that earnings do not directly translate into cash flows, and a business is worth only the present value of its future cash flows, not the present value of its future earnings. Key differences between free cash flows and earnings are capital expenditures, working capital, and non-cash expense items like depreciation.
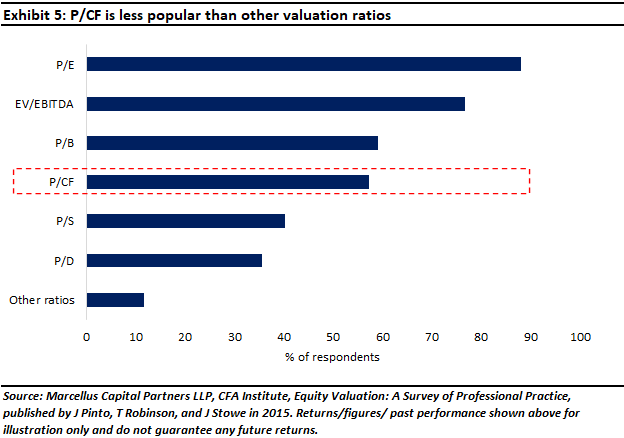
Since price to earnings ratio (P/E) is the most popular valuation ratio, we thought it would be relevant to compare our preferred price to free cash flow (P/FCF) ratio to price to earnings (P/E) ratio and other commonly used valuation ratios like enterprise value to EBITDA (EV/EBITDA), and price to book (P/B). A lower relative valuation ratio would seemingly indicate greater undervaluation and a more attractive investment opportunity.
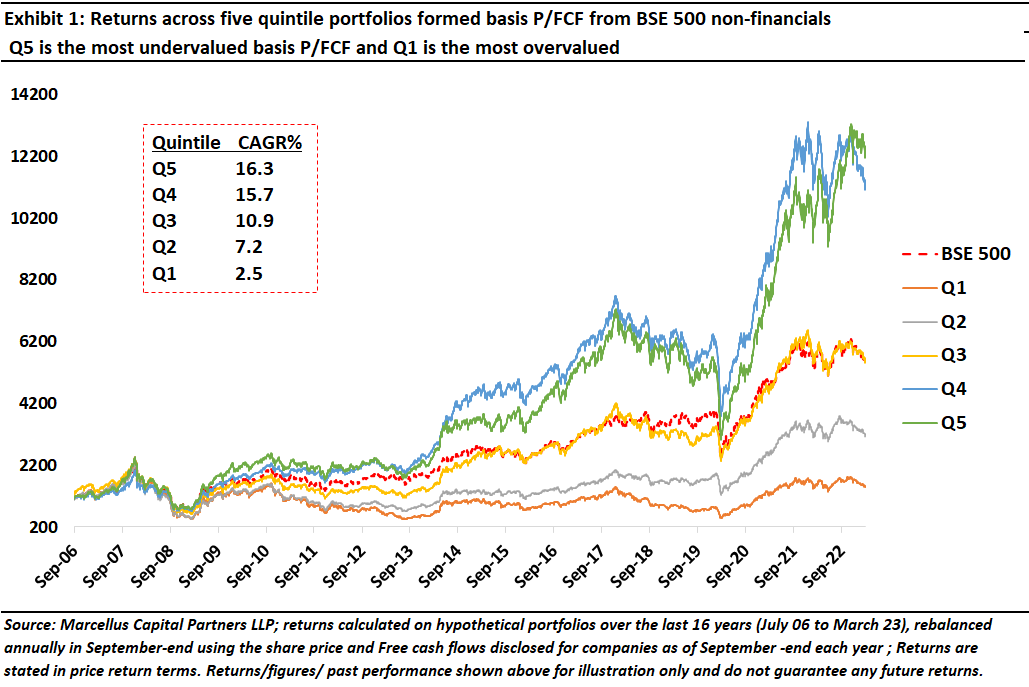
For the purpose of this analysis, we considered all the non-financial services stocks in the BSE 500 and sorted them into five equal sized buckets (quintiles) basis P/FCF. As comparing valuation ratios with negative earnings or EBITDA or free cash flows is not meaningful, inverse of the valuation ratio is used to actually sort companies into each quintile. Financial services stocks are excluded for the purpose of this analysis as capital expenditures, working capital, and depreciation are not meaningful for them.
Exhibit 1 shows that quintile 5 (Q5) representing the cheapest 20% of companies (with lowest P/FCF) comfortably outperforms the most expensive 20% of companies (Q1) among BSE 500 non-financial services stocks. Also, returns increase as we go from Q1 to Q5.
Exhibit 2 shows some fundamental metrics for each of the quintiles. Quintile 1 is mostly made-up of companies not being able to generate positive free cash flow. As we move to the higher quintiles, free cash flow generation improves along with better ROCE and lower debt to equity. This is to be expected as generating free cash flow implies robust profitability – the company must generate more cash than it burns in the course of running its business. Also, companies with strong free cash flow generation require less external debt financing to grow.
Exhibit 2 shows that Q4 has the highest ROCE and lowest debt to equity among all other quintiles. In fact, as shown in exhibit 2, quintile 4 returns are close to quintile 5 and, though not shown here, quintile 4 also shows the best risk adjusted returns among all quintiles. This suggests that performance of Q5 (the cheapest quintile basis P/FCF) is most likely to be dragged down by value traps (that is stocks which are justifiably undervalued because of weak fundamentals). As we have argued in our inaugural newsletter published in November last year “Moneyball of Quality Investing”, screening for companies with strong fundamentals should be a prerequisite before we consider selecting basis any valuation measure.
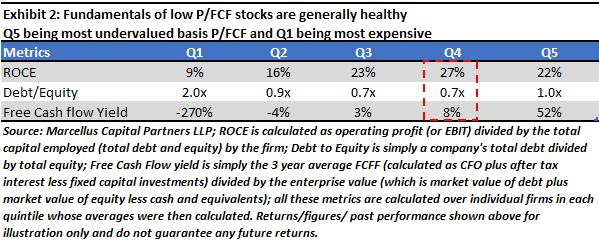
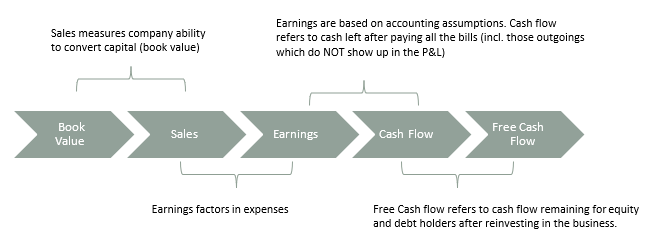
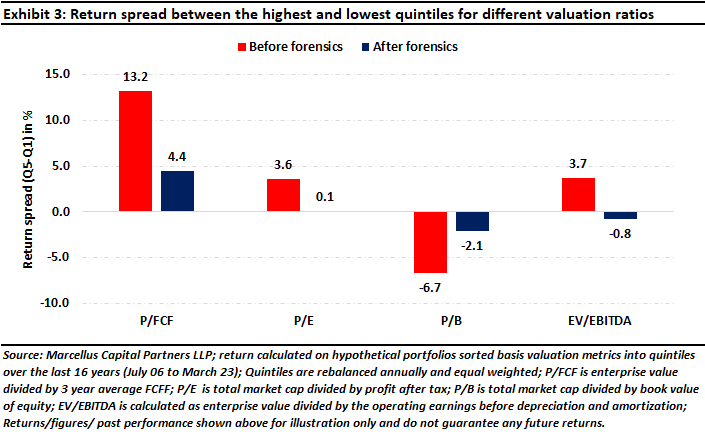
Exhibit 3 shows the return spread between quintile 1 and quintile 5 portfolios, for different valuation ratios. For each valuation ratio, the quintile portfolios are formed by sorting on the ratio as of September-end every year and equal weighting among all the stocks within the quintile bucket. In Exhibit 3, again only non-financial services stocks in BSE 500 are considered under ‘before forensics’ whereas under ‘after forensics’ only non-financial services which qualify through the Marcellus forensic screen are considered (more details on the forensic screening can be found in our February newsletter “Forensic accounting through quant lens boosts returns”).
The higher the spread between quintile 1 and quintile 5 portfolios’ returns, the more effective is the valuation ratio in separating the men (women) from the boys (girls) i.e., separating the outperformers from the underperformers. As is evident from Exhibit 3, the free cash flow-based valuation measure is the most effective whether we look at the companies in BSE 500 or those remaining after the forensic screen has done its work. Spread compression after forensic screening is due to removal of companies which have accounting issues and are therefore more exposed to large drawdowns. [Effectively, the forensic screen, like a Joint Entrance Exam, removes the rottenest apples and reduces the heterogeneity of the underlying population of companies.]
Advantages of FCF based value measure:
To invest in MeritorQ through Smallcase, please go to https://marcellus.smallcase.
If you would like to know more about MeritorQ, please write to help.ia@marcellus.in