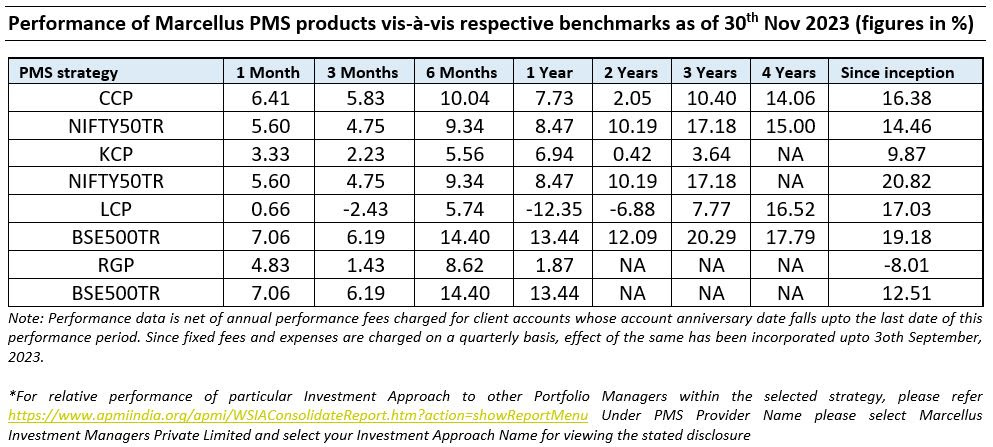
Consistent Compounders Portfolio (CCP)
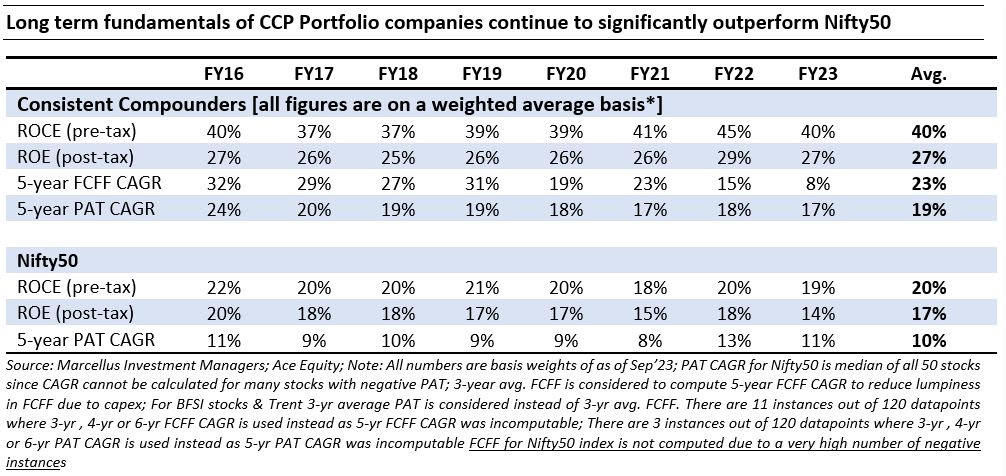
Companies in our Consistent Compounders Portfolio generated median PAT growth of 24% YoY in 2QFY24 and 27% YoY in 1HFY24. This acceleration in PAT growth is an outcome of both: a) accelerated market share gains and improved operating efficiencies as an outcome of capital allocation decisions taken over the last 3 years; and b) recovery in profit margins due to normalization of input costs for companies like Asian Paints, Pidilite, Nestle etc.
From a risk perspective, there are several pockets of changes in competitive intensity in the industries where our portfolio companies operate. Some of these are examples of potential rise in competitive intensity (e.g. Grasim’s entry in Paints), while others are examples of decline in competitive intensity (e.g. moderation in competition from e-pharmacies and aggregators in the diagnostics industry). There are also few possibilities of radical disruption of the industries in which our portfolio companies operate – e.g. lab grown diamonds in jewellery, fintech based lending, tech-based sales, distribution and supply chains etc. – and we are focused on ensuring that we remain invested with potential disruptors rather than being exposed to the businesses which might get disrupted in such industries.
The recent regulatory change around increase in risk weights in unsecured credit and NBFC credit in the banking system is likely to have an a positive impact on lenders in our portfolio due to reduction in competitive intensity allowing the prudent lenders with leeway on leverage to aggressively pursue higher market share. According to report from the brokerage firm UBS, disbursement to customers with credit scores below 577 (relatively high-risk customers) came to 22% for the overall industry. The same number was around 23% for PSU banks, about 29% for NBFC and only 13% for the large private banks. Given the rampant growth in unsecured loans by PSUs and NBFCs, some degree of rationality is warranted, though the extent and timing of the same is difficult to predict. Combined with CCP portfolio lenders’ historically low valuations, the current scenario presents a situation with asymmetrical payoff for investors.
We have implemented several changes to position sizing / stock selection in our CCP portfolio over the last few months to benefit from the opportunities presented by such disruptive opportunities, regulatory changes, valuation attractiveness and change in competitive intensity in various industries. The most notable changes to position sizing / stock selection include increase in exposure to companies like Trent and Astral and exit from companies like Berger from our portfolio (to maintain the concentration of the portfolio to 13-15 companies).
Kings of Capital Portfolio (KCP)
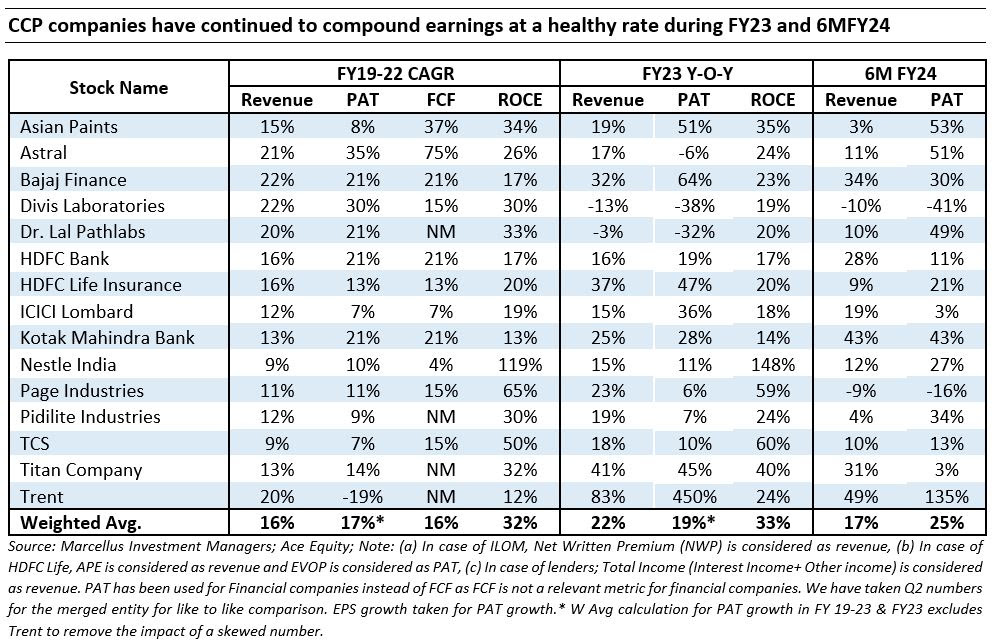
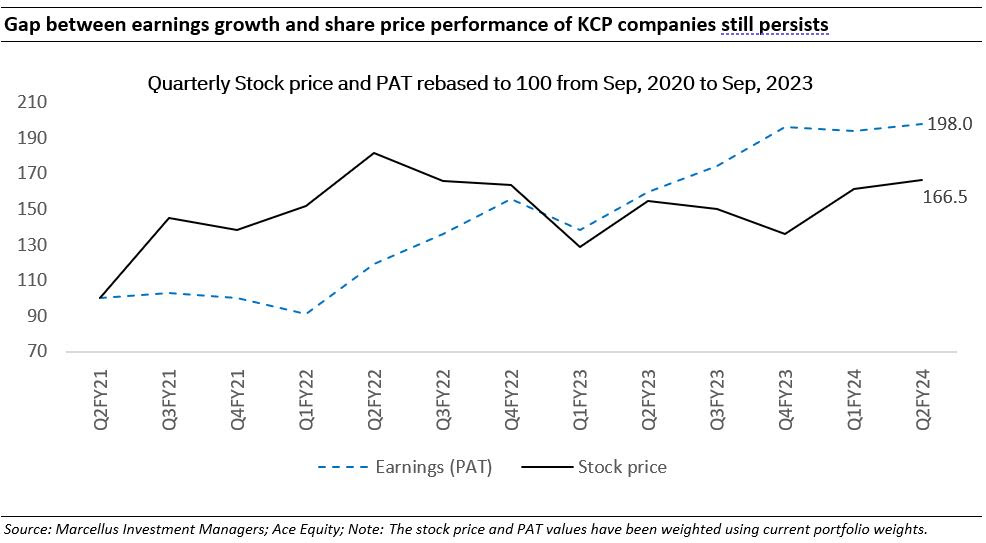
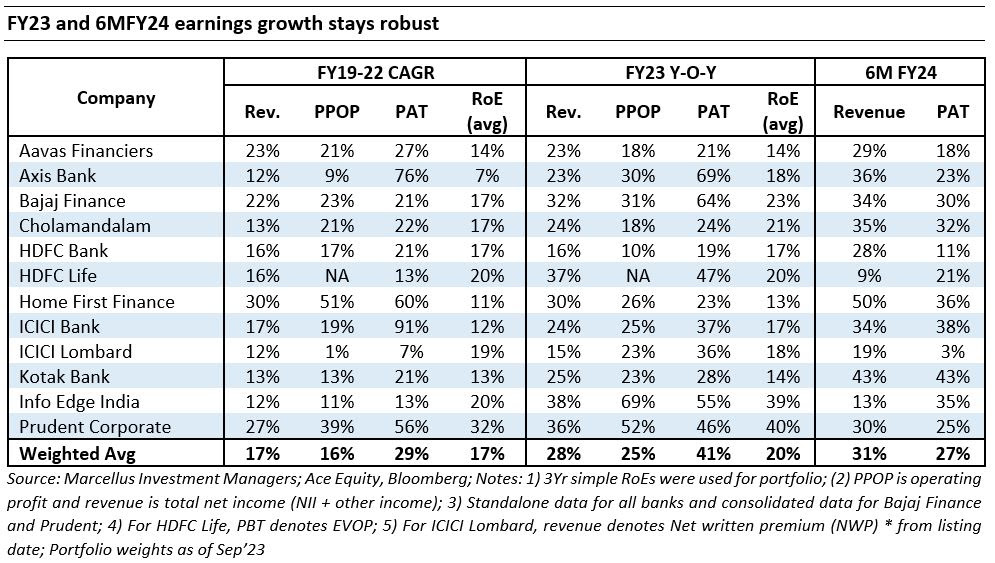
Kings of Capital portfolio companies have reported robust revenue and profit growth for H1FY24 with weighted average revenue growth of 17% and weighted average PAT growth of 25% for the portfolio. These numbers suggest strong market share gains for KCP companies as they reported better than industry growth across lending and insurance businesses. As seen in the table below, this trend of market share gains and strong fundamentals has been consistent through the past three years but FY23 was a year of significant share price dislocation as multiple stocks which reported 20%+ earnings growth saw a 10%-30% correction in their stock price. This resulted in fundamentals and stock prices going in opposite directions. In YTDFY24 we are seeing a reversal of this trend as stock prices are catching up with the strong fundamentals. However, we believe KCP stocks have still quite a bit of catching up to do as illustrated in the table below:
The RBI recently increased risk weights for unsecured loans and bank loans to NBFCs as a cautionary step to slow down unsecured consumer lending. As this was announced, the stock market painted all lenders with the same brush leading to a temporary stock price correction for all types of lenders. However, we believe this has multiple long term positive implications for KCP lenders.
Little Champs portfolio (LCP) & Rising Giants Portfolio (RGP)
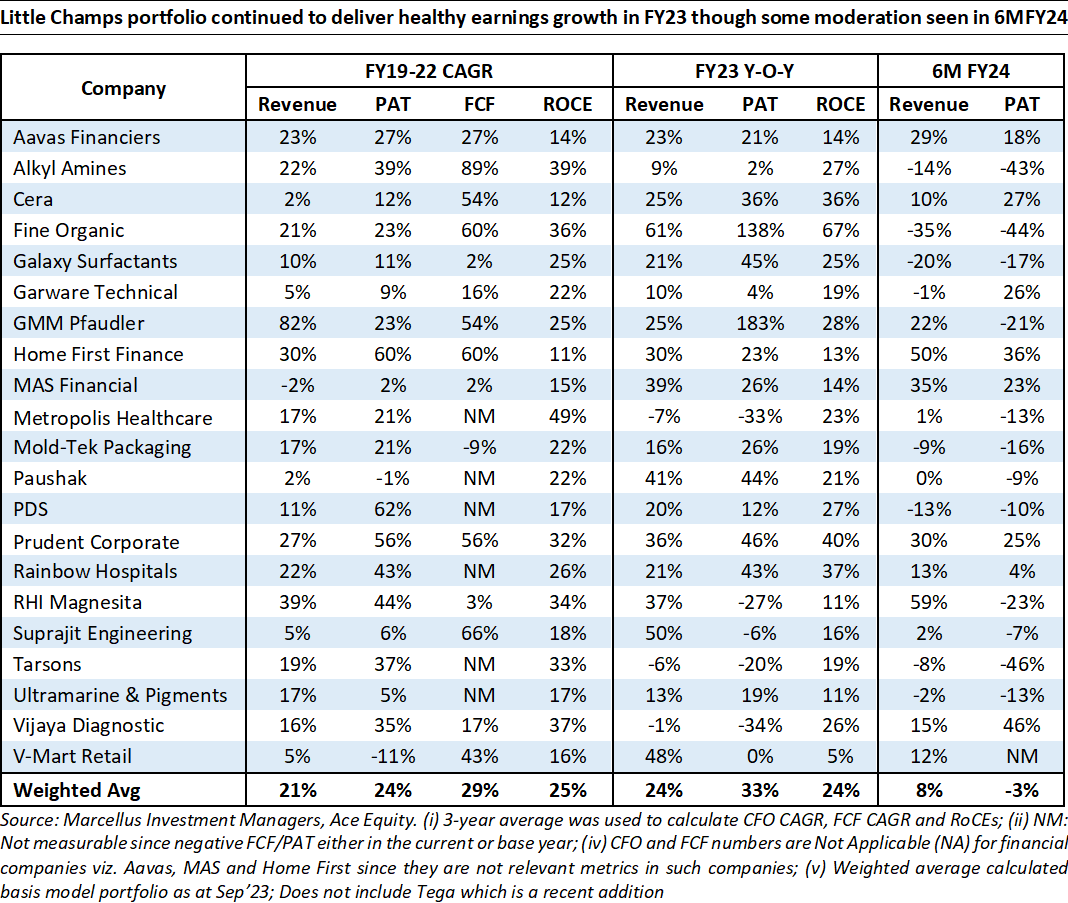
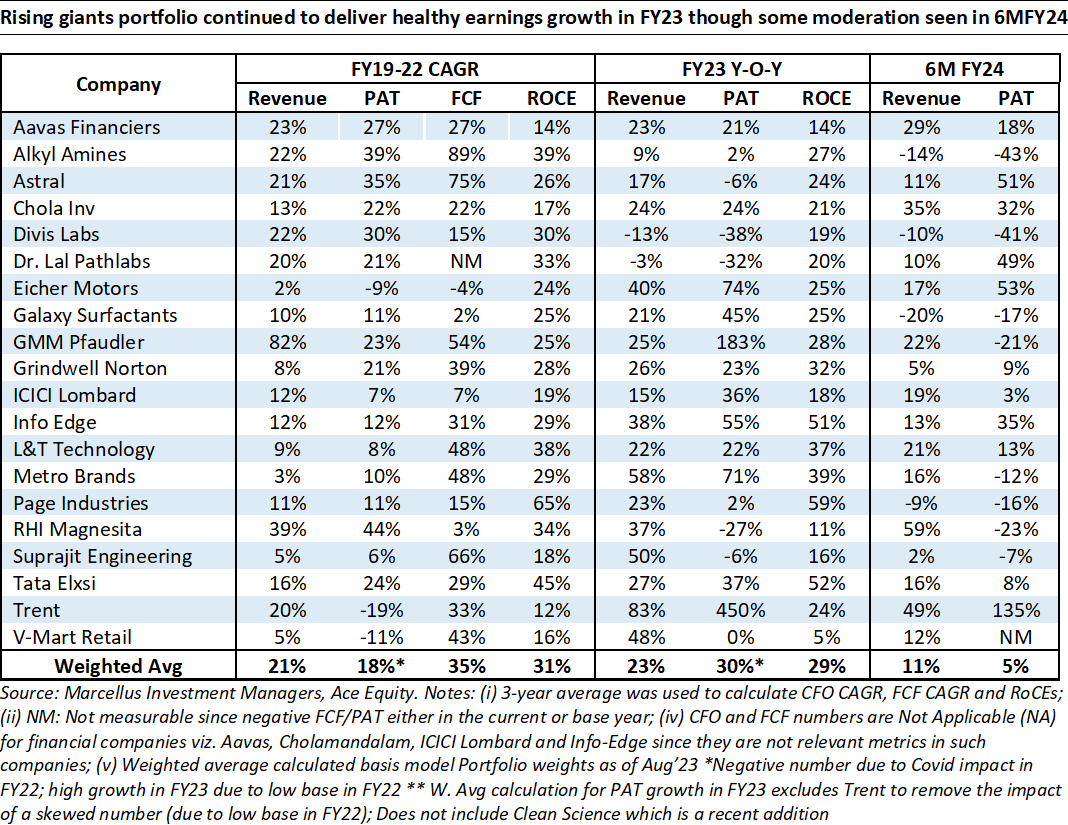
We had highlighted in the last month’s newsletter that 2QFY24 was a challenging quarter for the Little Champs portfolio emanating from earnings headwinds faced by the chemical stocks, weakness in the global markets generally impacting the export-oriented portfolio companies and one-offs in last year’s base optically impacting the earnings for couple of stocks. For similar reasons, the Rising Giants portfolio also witnessed a modest growth in earnings (though better than Little Champs portfolio).
We also highlighted in the newsletter why we believe the above factors are transient in nature and we continue to be sanguine about the medium-long term prospects of our portfolio companies.
However, it seems the market is extrapolating the current headwinds much deeper into the future for the portfolio companies. For instance, the LCP portfolio’s current P/E (on FY24 projected earnings) is close to 28x – down >20% from the level 2 years back. A P/E of <30x implies that the market believes the firms in the Little Champs portfolio would continue their dominance (i.e. longevity of healthy earnings/cash flow growth) for just about 8 years in the future – which highly underappreciates the level of moats and capital allocation skills these firms enjoy. (Note the key assumptions in calculation of 8 years above: Free Cash Flow growth of 22%, cost of equity of 12%, terminal growth of 5% with a fade of 5 years). Similarly, the Rising Giants portfolio currently trades, on a median basis, at 34x FY24 projected earnings, again severely undermining the compounding power and longevity thereon of the portfolio companies.
We believe given the current valuation levels, any uptick in earnings can result in disproportionate gains in the share prices for the portfolio companies.
We have made the following changes to the Little Champs and Rising Giants portfolios:
Addition of Tega Industries to the Little Champs portfolio:
Tega Industries (Tega) is a leading manufacturer of specialized critical-to-operate and recurring consumable products for the global mineral beneficiation, mining and bulk solids handling industry. Tega is the world’s second-largest manufacturer of polymer-based mill liners and fourth largest player in the overall mill lining market. Its DynaPrime range of mill lining has been designed specifically for the bigger size of the mills where modern liner handlers are available and it helps in reducing the number of pieces being installed inside the mill, thereby reducing the installation downtime. It has few non-mill lining products include Trommels & Screens, Hydrocyclones and Conveyor Products. Tega’s competitive advantages include:
The company acquired McNally Sayaji Engineering in Feb’2023 for Rs.165 crores. McNally, an 80-year-old company which was undergoing insolvency proceedings. It is engaged in manufacturing of crushers, screening equipments, grinding equipment, material handling and mineral processing equipment, etc. The said acquisition will expand Tega’s addressable market, provide manufacturing base in Southern India, and provide with cross-selling opportunities.
Addition of Clean Science to the Rising Giant portfolio:
Clean Science and Technology Ltd. (CSTL) is a leading manufacturer of chemicals for polymer, packaged food, pharma and cosmetics industry. It is the global market leader in manufacturing of MEHQ, which is a polymerization inhibitor and also in manufacturing of BHA & Ascorbyl Palmitate which are used as antioxidants in edible oil and packaged food industries. CSTL’S advantage lies in its proprietary catalytic manufacturing processes which have alternate starting points compared to conventional processes used by peers and which have higher yields and lower waste / effluent generation. Company has also done forward and backward integration for its core products which has allowed it to have better control on its cost structures and also to drive better value from its portfolio. In addition to the products which have global leadership (in terms of market share), CSTL has been building its product portfolio very aggressively by getting into adjacencies where the addressable market size is multi-folds larger than core products, and which are more technically complex. This provides both – greater moats and longer growth runway for the company.
In the last five years, company has delivered revenue CAGR of 31% and PAT CAGR of 43%. The company is debt free and its average ROCE and ROE in last five years have been 51% and 40% respectively.
Regards,
Team Marcellus
If you want to read our other published material, please visit https://marcellus.in/